Verification statistics provide a measure of what meteorologists refer to as forecast skill. A more-skillful forecast is one with lower forecast errors. So long as a skillful forecast is effectively communicated to those who would use it to take action (such as emergency managers to coordinate government response, or the general public to coordinate preparation activities), a more-skillful forecast is generally also a more valuable forecast.
Four types of verification plots are provided:
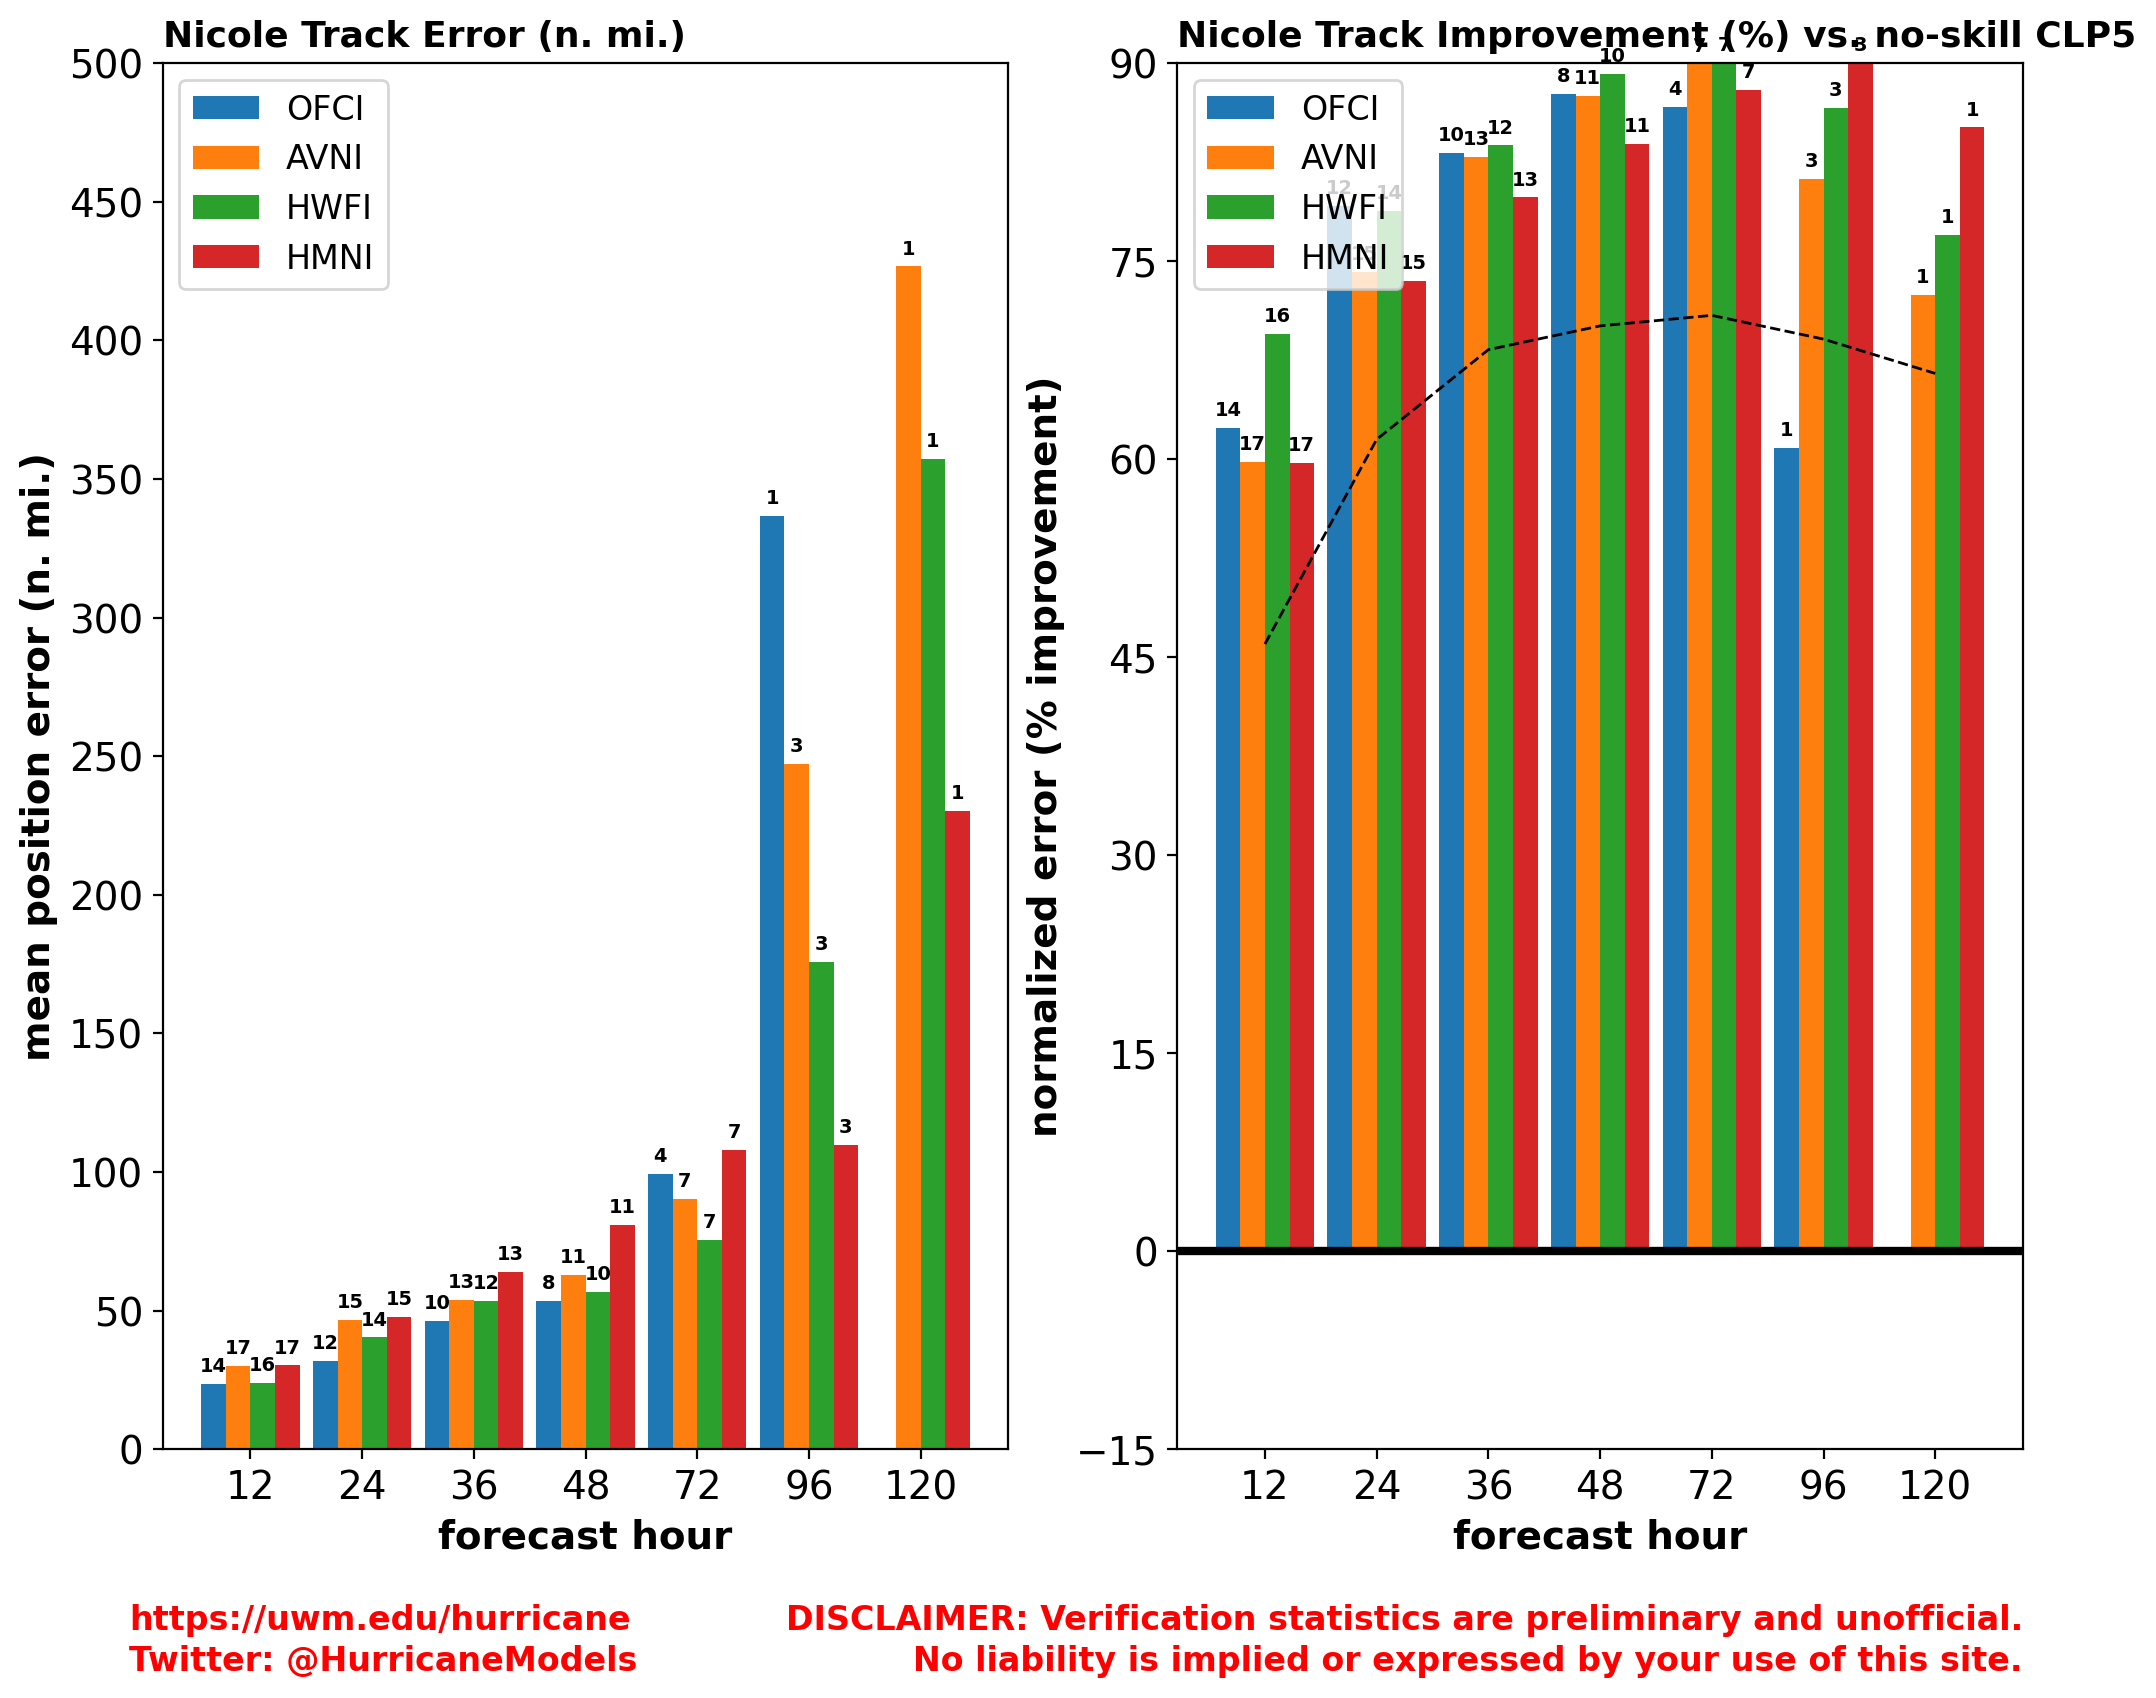
- Track: The mean position error for the official NHC/CPHC forecasts and selected models (GFS, HWRF, HMON), averaged over all forecasts, at 12, 24, 36, 48, 72, 96, and 120 h lead times. A second panel normalizes these errors by the error of a no-skill climatology and persistence forecast (known as OCD5). This helps account for cases when a storm is inherently easier or harder to forecast. Larger percentage improvements relative to the no-skill forecast denote more-skillful forecasts, with bars extending above the dashed black line indicating greater skill improvements as compared to the most-recent 5-yr mean for NHC/CPHC official forecasts. Numbers atop the bars indicate the number of forecasts entering into the verification.
- Intensity: The absolute intensity error for the official NHC/CPHC forecasts and selected models (HWRF, HMON, Decay-SHIPS, LGEN), averaged over all forecasts, at 12, 24, 36, 48, 72, 96, and 120 h lead times. As for track, a second panel normalizes these errors by the error of the OCD5 no-skill climatology and persistence forecast.
- Official Forecasts: There are two types of official forecast verification plots. The first depicts the position and absolute intensity error for each official NHC/CPHC forecast at 12, 24, 36, 48, 72, 96, and 120 h lead times. The second depicts these errors normalized by those of the OCD5 no-skill climatology and persistence forecast. As compared to the other verification plots described above, which average all forecasts over a storm's history, these plots help identify individual forecasts with relatively high or relatively low skill.
All verification statistics are calculated against the NHC's working best-track, or preliminary archive, data. Official verification procedures use the finalized best-track or archive data, which is not available until after each hurricane season is complete. Thus, the final statistics you see here for each storm may not match those produced by the NHC at the end of the season.
Finally, past performance is no guarantee of future outcomes. The atmosphere is chaotic - literally - and thus a model that had small errors for one time and/or one storm will not necessarily have small errors for another time and/or another storm.

Above: Example track forecast verification statistics for North Atlantic Hurricane Nicole (2022).