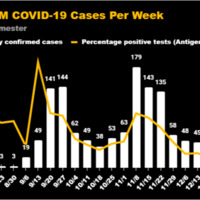
New UWM COVID cases per week, Fall 2020 semester graphic
Dublin Core
Title
New UWM COVID cases per week, Fall 2020 semester graphic
Description
The graphic not only gives statistically-grounded context for life on the UWM campus during the fall semester of 2020, but directly relates to the UWM Student Association in that it was produced as part of a spreadsheet maintained by UWMSA member Clarence Kinnard. Kinnard reports that he produced this graphic each week not in an official capacity as part of his role within the Student Association, but in a personal effort to stay informed about the course of the pandemic, one which he self-deprecatingly describes as “obsessive”.
Creator
Ben Schultz
Contributor
Clarence Kinnard
Files
Collection
Reference
Ben Schultz, New UWM COVID cases per week, Fall 2020 semester graphic

